To fully appreciate how weather affects a region, we need to use maps to show the magnitude and extent of prevailing weather systems. These weather maps (also called synoptic weather maps or synoptic weather charts when they cover very large areas) also help us to make forecasts of weather for a few days to weeks. For countries in higher latitudes the weather conditions can change from sunny to snowing in a very short time. Extremes of weather make it very important to keep abreast of weather conditions in these regions to plan for administrative, business and leisure activities. Health and safety decisions also depend on knowledge of the current atmospheric conditions.
In meteorology, weather station models are symbolic illustrations that give a synopsis of the weather conditions at a particular location (a weather station). Though different combinations of information and arrangement of symbols are used by various meteorological institutions, the labelled Station model below summarizes key symbols used on synoptic weather maps.
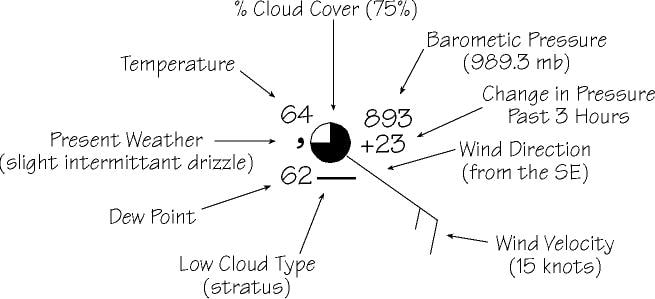
On weather maps, pressure is usually denoted by isobars (as seen in the background image of this page's title). Dew point may or may not be included and sometimes past weather conditions (for example, the symbols for 'showers' or 'drizzle') may be represented at the bottom right of the station model (though it is not included in this model). Most modern synoptic charts may not include individual station models as these are only used to plot the trend of atmospheric conditions over a large area.
In addition to describing the elements of weather for particular locations, meteorologists need to interpret what is going on over a large area in order to make forecasts. Click to view the YouTube video below to see how this is done.
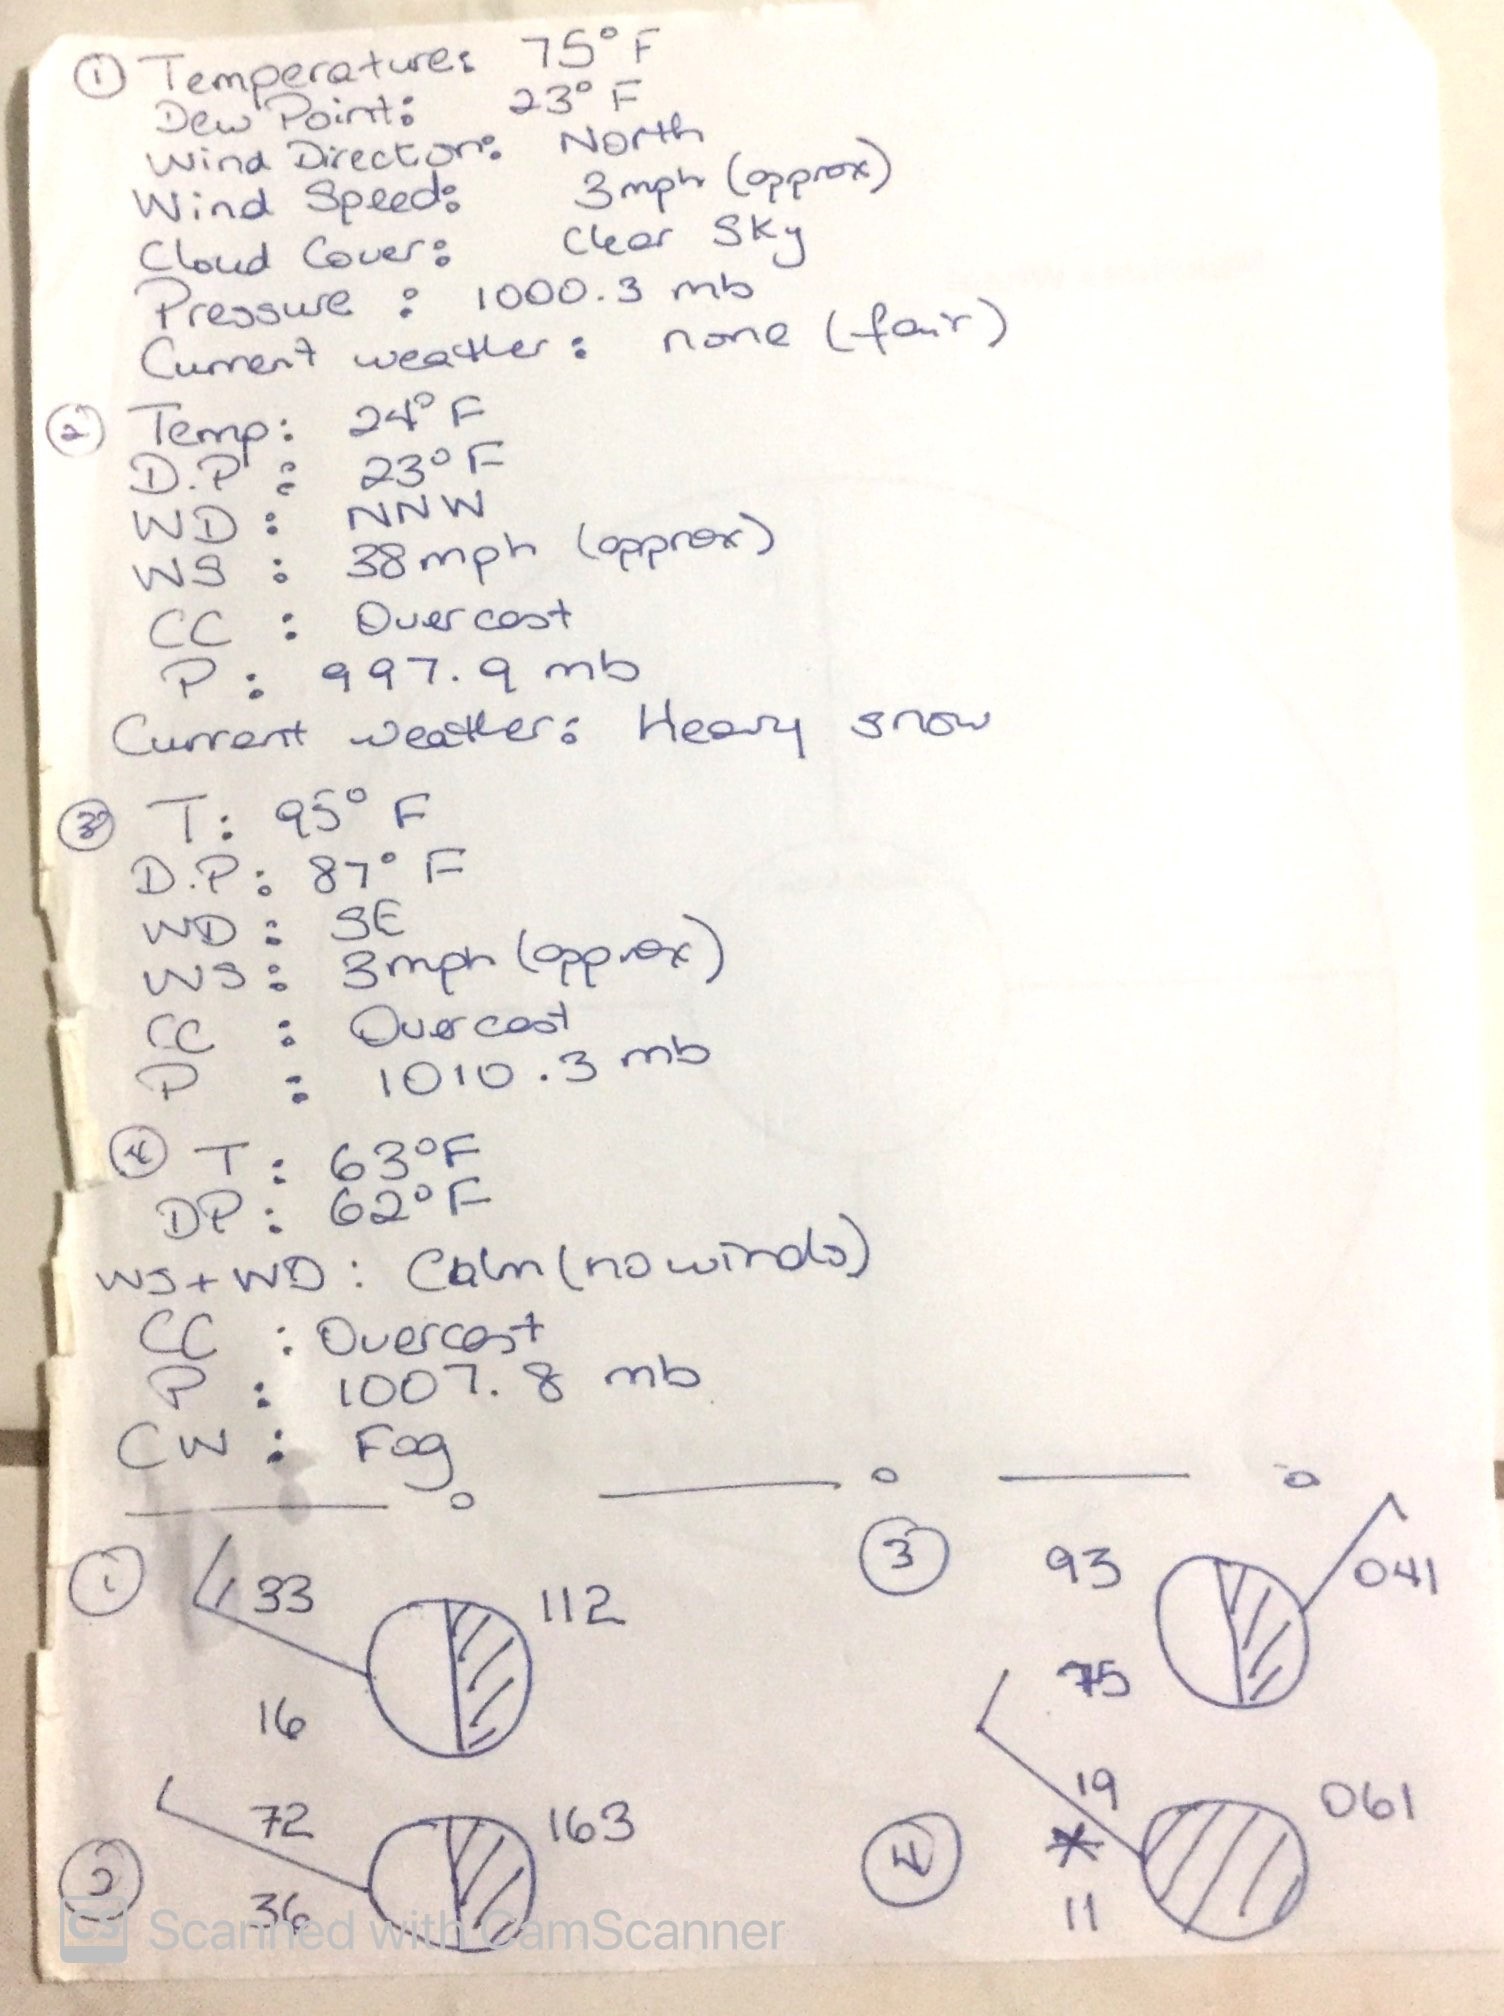
Download the file below and complete the worksheet. The solutions will be uploaded next week Friday 22nd May, 2020!
| solutions_weather_station_worksheet.jpg |
| statmodpractice.pdf |
